")
Task 109
NASA Decision Support: Monitoring Air Quality Effects of Anthropogenic Emissions Reductions and Estimating Emissions from Natural Sources
Principal Investigator(s):
D. Allen
Sponsor(s):
K. Pickering
Last Updated:
October 26, 2012 15:25:23
Description of Problem
An accurate specification of anthropogenic and natural emissions is crucial for determining the impact of emission perturbations on air quality. However, when this project began, lightning-NO emissions, a substantial contributor to tropospheric NO2 columns over the United States during the summertime, were not included in the Community Multiscale Air Quality (CMAQ) model used by the Environmental Protection Agency. The first goal of this project was to add lightning-NO emissions to CMAQ. Simulations with lightning-NO emissions provide more accurate estimates of nitrogen deposition and are useful for top down estimates of anthropogenic emissions. The second goal of this project was to use tropospheric nitrogen dioxide (NO2) columns retrieved from the Ozone Monitoring Instrument (OMI) aboard NASA’s Aura satellite to refine emissions of nitric oxide (NO) by microbial activity in soils calculated by the Biogenic Emission Inventory System (BEIS) that is used within the EPA’s Community Multiscale Air Quality Model (CMAQ).
Lightning-NO emissions in the CMAQ model were parameterized using a previously developed method that utilizes the relationship between flash rate and convective precipitation rate. The resulting flash rate distributions were scaled so that monthly average model flash rates match observed monthly average flash rates where the “observed” flash rates were determined using National Lightning Detection Network (NLDN) cloud-to-ground (CG) flash rates for the months of interest and climatological IC (intracloud)/CG ratios. CMAQ simulations were run with the improved source distributions for lightning-NO. Results were evaluated and the resulting algorithm is included as an option in the most recent release of CMAQ.
In order to evaluate how well CMAQ captures changes in NO2 columns associated with soil-NO emissions from BEIS, we compared changes in modeled and OMI-retrieved columns following precipitation events. Our goal was to determine if changes in NO2 columns associated with soil-NO emissions were visible in the OMI data set and if the observed changes were consistent with what was modeled via simulations with CMAQ. In order to put bounds on the emissions, we also performed CMAQ simulations with no soil-NO emissions and with doubled soil-NO emissions.
Scientific Objectives and Approach
Accomplishments
During the first two years of this project, lightning-NO emissions were prepared for use in CMAQ simulations designed to study the impact of lightning-NO production on tropospheric photochemistry, surface air quality, and nitrogen deposition during the summers of 2004 and 2006.
During the most recent year, we provided a final version of this algorithm to EPA. We worked with EPA personnel as they implemented this algorithm into CMAQ. It is available to the scientific community in the most recent release of CMAQ. In February 2012, a paper summarizing the results of this project appeared in the journal, Atmospheric Chemistry and Physics. As part of this article, we studied the impact of lightning-NO production on wet deposition of oxidized nitrogen (nitrate) over the eastern United States (longitudes east of 100° W). Figures 1a-d compare wet deposition rates from National Acid Deposition Program (NADP)monitoring sites to modeled deposition rates for simulations without (left) and with (right) lightning-NO production and for simulations with unadjusted (top) and adjusted (bottom) precipitation rates. Model wet deposition of nitrate is 27.5% too low without lightning-NO production (Figure 1a). Adding lightning-NO production eliminates this low-bias (Figure 1b). However, the resulting fit shows considerable scatter (RMSc=0.13) and correlations between model and NADP deposition rates of nitrate are only moderate (R = 0.50). The scatter is reduced and correlations improve when adjustments are made for biases in modeled precipitation with respect to NADP-measured precipitation. When these adjustments are made, RMSc decreases to 0.10 and the correlation increases to 0.76 (Figure 1d).
As the last part of the lightning-NO component of this project, we are providing monthly average estimates of cloud-to-ground and total flash rates over the United States to the CMAQ community for the 2002 to 2010 time period. These flash rates distributions will make it possible to use month specific lightning-NO emissions in CMAQ simulations of tropospheric photochemistry and air quality over the United States.
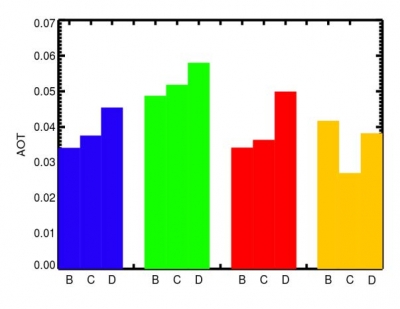
As part of the soil-NO component of this project, we performed CMAQ simulations of spring 2006 using three different assumptions on soil-NO emissions (no emissions, standard BEIS emissions, and doubled BEIS emissions). The simulations suggested that
soil-NO adds 8-22% to the tropospheric NO2 column over the US (east of 110°W). The simulations also indicated that doubling the Yienger-Levy soil-NO source in BEIS decreased the bias between model and satellite retrieved NO2 columns from -10% to -2%. (Figure 2). After examination of 16 precipitation events over the central Plains regions, we determined that model-calculated and satellite-retrieved increases in NO2 columns associated with precipitation pulsing were also consistent with a doubled soil-NO source. However, the large uncertainty range on the satellite-retrieved changes makes it difficult to further refine the soil-NO source using satellite data.
Other Publications and Conferences
Conference Presentations:
Allen, D. J., L. Silverman, S. Ehrman, K. Pickering, H. Plata, and T. Pierce, Soil NOx model/satellite measurement intercomparisons, 2011 CMAS meeting, Chapel Hill, NC.
Allen, D. J., K. Pickering, R. Pinder, B. Henderson, K. W. Appel, and. A. Prados, Impact of lightning-NO on eastern United States photochemistry during the summer of 2006 as determined using the CMAQ model, 2011 CMAS meeting, Chapel Hill, NC.
Allen, D. J., K. Pickering, R. Pinder, B. Henderson, W. Koshak, and T. Pierce, Impact of lightning-NO emissions on eastern United States photochemistry during the summer of 2006 as determined using the CMAQ model, 2011 AMS meeting, Seattle, WA.
Allen, D. J., K. Pickering, R. Pinder, B. Henderson, W. Koshak, and T. Pierce, Impact of lightning-NO emissions on eastern United States photochemistry during the summer of 2006 as determined using the CMAQ model, 2010 CMAS meeting, Chapel Hill, NC.
Allen, D. J., K. Pickering, R. Pinder, and T. Pierce, 2010: Impact of lightning-NO emissions on eastern United States photochemistry determined using the CMAQ model. 2010 AMS Meeting, Atlanta, GA.
Allen, D. J., K. Pickering, R. Pinder, and T. Pierce, 2009: Impact of lightning-NO emissions on eastern United States photochemistry during the summer of 2004 as determined using the CMAQ model. 2009 CMAS meeting, Chapel Hill, NC.
Publications:
Allen, D. J., K. E. Pickering, R. W. Pinder, B. H. Henderson, K. W. Appel, and A. Prados, Impact of lightning-NO on eastern United States photochemistry during the summer of 2006 as determined using the CMAQ model, Atmos. Chem. Phys., 12, 1737-1758, 2012.


