")
Task 133
Polar Climate System
Principal Investigator(s):
L. Boisvert
Sponsor(s):
T. Markus
Last Updated:
October 26, 2012 15:25:34
Description of Problem
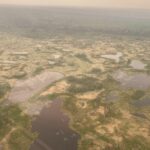
We want to calculate the moisture flux over the entire Arctic using satellite data on board NASA’s Aqua satellite daily from 2003-2009. We would like to study how the moisture flux has been changing in recent years with the dramatic changes in the Arctic sea ice pack thickness, compactness, and extent. We would like to compare these findings to recent studies dealing with Arctic cloud changes in recent years to see if they relate. We began with a small-scale study of the North Water polynya in order to test the accuracy of the satellite data before moving on to the entire Arctic sea ice pack.
Scientific Objectives and Approach
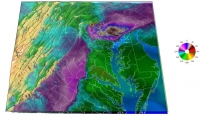
Satellite data were applied to calculate the moisture flux from the North Water polynya during a series of events spanning 2003-2009. The fluxes were calculated using bulk aerodynamic formulas with the stability effects according to the Monin-Obukhov similarity theory. Input parameters were taken from three sources: air relative humidity, air temperature, and surface temperature from the Atmospheric Infrared Sounder (AIRS) onboard NASA’s Earth Observing System (EOS) Aqua satellite, sea ice concentration from the Advanced Microwave Scanning Radiometer (AMSR-E, also onboard Aqua), and wind speed from the ECMWF ERA-Interim reanalysis. Our results show the progression of the moisture fluxes from the polynya during each event, as well as their atmospheric effects after the polynya has closed up. These results were compared to results from studies on other polynyas, and fall within one standard deviation of the moisture flux estimates from these studies. Although the estimated moisture fluxes over the entire study region from AIRS are smaller in magnitude than ERA-Interim, they are more accurate due to improved temperature and relative humidity profiles and ice concentration estimates over the polynya. Error estimates were calculated to be 5.56 x10⁻³ g m-2 s-1, only 25% of the total moisture flux, thus suggesting that AIRS and AMSR-E can be used with confidence to study smaller scale features in the Arctic sea ice pack and can capture their atmospheric effects. These findings bode well for larger-scale studies of moisture fluxes over the entire Arctic Ocean and the thinning ice pack.
I am currently using the Monin-Obukov Similarity Theory and data from NASA’s Aqua satellite in order to compute the moisture flux over the entire Arctic sea ice pack daily from 2003-2009. I am looking at sea surface temperatures, air temperature profiles, relative humidity profiles, surface temperature, geopotential height and ice concentration from these sensors. I hope to be able to see changes and trends in the moisture flux on a yearly, seasonal and monthly basis and compare my results to recent studies done with changes in Arctic clouds. I also hope to make some changes to the Monin-Obukov Similarity Theory that better suit the conditions present in the Arctic to make more accurate moisture flux estimates and compare these to ECMWF Interim reanalysis data.
Accomplishments
In December I defended my thesis topic in front of my committee and it was accepted. I will also be receiving my Master’s degree in the UMD 2012 May Commencement. We have recently been accepted for publication in the Journal of Geophysical Research- Atmospheres on our work of the moisture flux from the North Water Polyanya 2003-2009.
Refereed Journal Publications
Boisvert, L. N., T. Markus, C. Parkinson, and T. Vihma (2012), Moisture Fluxes Derived from EOS Aqua Satellite Data for the North Water Polynya over 2003-2009, J. Geophys. Res., 2011JD016949, in press.
Other Publications and Conferences
Boisvert, L., ‘Moisture Fluxes Derived from EOS Aqua Satellite Data over the North Water Polynya 2003-2009’, 2011Summer School for Polar Scientists, University of Reading, UK.
Boisvert, L., and T. Markus, ‘Sea Surface Temperatures: High latitude SSTs and their Interaction with the Arctic Sea Ice Cover’, World Climate Research Program (WCRP) Conference, Denver, CO.


