")
Task 235
Arctic and Southern Ocean Sea Ice
Principal Investigator(s):
S. L. Farrell
Sponsor(s):
T. Markus
Last Updated:
October 26, 2012 15:26:02
Description of Problem
The work being conducted under this project is in support of NASA’s Ice, Cloud, and land Elevation Satellite-2 (ICESat-2) scheduled for launch in 2016. ICESat-2 is a follow-on to the ICESat mission, which operated between 2003 and 2009. ICESat-2 will provide sustained monitoring of changes in ice-sheet mass balance, and Arctic and Southern Ocean sea ice volume. The goals under this ICESat-2 Science Definition Team (SDT) project are to derive the Level 1 and 2 sea ice science requirements and measurement accuracies, and to determine the optimum spatial sampling strategy for profiling the complex sea ice environment of the Arctic and Southern Oceans.
Scientific Objectives and Approach
We aim to define the optimal footprint size, spacing, and ground-track configuration, for sea ice observations using satellite laser altimetry. The system is required to obtain representative elevation measurements over sea ice, and identify leads within the ice pack, so as to provide accurate measurements of sea surface height, sea ice freeboard, and ultimately sea ice thickness. The technical approach is to use airborne laser altimetry data to simulate ICESat-2-type data prior to launch. Analysis of airborne data gathered over Arctic sea ice is used to perform a trade study for the various multi-beam systems being considered for the ICESat-2 mission, as well as to identify possible sources of geophysical range error.
Accomplishments
The laser altimeter to be carried on ICESat-2 is the Advanced Topographic Laser Altimeter System (ATLAS), which will use a photon-counting, multi-beam system with variable beam energy and dense along-track sampling [Abdalati et al., 2010]. The proposed sampling approach should provide improved detection of leads in the ice pack, which are critical for estimating sea ice freeboard and deriving sea ice thickness [e.g. Farrell et al., 2011a]. ATLAS therefore represents a departure from the analogue laser techniques used on ICESat, so new algorithm development is critical for the identification of cryospheric features using photon-counting data.
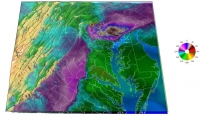
The major accomplishment under this Task during the reporting year was a first assessment of airborne photon-counting data from the Multiple Altimeter Beam Experimental Lidar (MABEL) system, over a frozen lake surface, which acts as a sea ice analogue [Farrell et al., 2011c]. MABEL is a high-altitude airborne simulator intended to test the instrument theory of the ICESat-2 laser altimeter ATLAS. A number of MABEL test-flights were conducted in 2011 over land in the western United States. The main objective of our analysis was to take a first look at MABEL L2A data over the sea ice analogue to become familiar with reading and processing photon-counting data. We also conducted an initial analysis of surface elevation accuracy, as well as an assessment of pitch and roll corrections. A prior simulation study conducted by Farrell et al. [2011a] comparing the digital photon counting approach proposed for ICESat-2 with conventional analogue systems showed that simulated ICESat-2 data could offer considerable improvements over ICESat. In particular, the dense along-track sampling of the surface should allow flexibility in the algorithmic approaches taken to optimize the signal-to-noise ratio, for accurate freeboard retrieval. Figure 1 shows our preliminary analysis of photon-counting data collected over the frozen surface of Lake Crowley, California. Each individual photon return is indicated by a blue dot. The highest photon density (darker blue line) originates from the surface return and demonstrates the surface-tracking capabilities of MABEL.
A secondary objective of work under this Task is to assist with defining the scientific goals of the ICESat-2 mission as they relate to the polar oceans and deriving the measurement requirements for observing the complex sea ice environment. During the reporting year we helped to develop a preliminary list of ICESat-2 data products associated with sea-ice including the definition of the basic Level 2 products such as sea surface and sea ice elevation, the derived Level 3 products such as sea ice freeboard and thickness, and the gridded Level 4 products such as monthly mean sea surface height and sea ice thickness distributions. We also provided guidance on MABEL test flights for the Spring 2012 Arctic campaign, particularly sea ice flight-line layout with the goal of optimizing links with IceBridge aircraft surveys and leveraging historical ICESat data.
Integral to the process of deriving sea ice freeboard (and thickness) is the accurate determination of sea surface height. Under one related research activity we constructed the highest resolution mean sea surface (MSS) mapping of the Arctic Ocean to date [Farrell et al., 2012]. Using a combination of ICESat-laser and Envisat-radar altimetry the new ICEn MSS contains details of the steepest sloping sea surface topography of the Arctic Ocean. Given that some short-wavelength error still exists in the best available Arctic geoids, the ICEn MSS can be used in place of a geoid to act as a reference surface for more accurate retrieval of sea ice freeboard. We Page 89 of 138
therefore plan to incorporate the ICEn MSS into the ICESat-2 pre-launch processing chain as required. Under a second, related research task, we assessed the lead mapping capabilities of the Digital Mapping System (DMS), a nadir-looking, high-resolution digital camera mounted on the aircraft associated with the NASA Operation IceBridge Mission [Farrell et al., 2011b; 2011d]. Discrimination of leads along-track is critical for deriving the elevation of open water within leads and defining sea surface height. The DMS digital imagery data were used to generate statistics on lead distribution and spacing, lead width, and areal coverage. Knowledge of such lead distribution statistics is used to assess the sampling geometries employed by current airborne and future satellite laser altimeters that map the complex sea ice environment, including the multi-beam photon-counting approach proposed for ICESat-2.
Dr. Farrell was recently selected to serve on the ICESat-2 Science Definition Team from January 2012 – 2015. As part of this project, the task lead will continue her work in support of the ICESat-2 mission in the run-up to launch, via investigation of airborne MABEL data over cryospheric targets such as sea ice/open ocean, to better quantify the extent of scattering issues and assist with algorithm development.
Refereed Journal Publications
Farrell, S. L., D. C. McAdoo, S. W. Laxon, H. J. Zwally, D. Yi, A. Ridout, and K. Giles, 2012: Mean Dynamic Topography of the Arctic Ocean, Geophys. Res. Lett., 39, L01601, doi:10.1029/2011GL050052.
Farrell, S. L., T. Markus, R. Kwok, L. Connor, 2011a: Laser altimetry sampling strategies over sea ice, Annals of Glaciology, 52 (57), 69-76.
Abdalati, W., H. J. Zwally, R. Bindschadler, B. Csatho, S. L. Farrell, H. A. Fricker, D. Harding, R. Kwok, M. Lefsky, T. Markus, A. Marshak, T. Neumann, S. Palm, B. Schutz, B. Smith, J. Spinhirne, C. Webb, 2010: The ICESat-2 Laser Altimetry Mission, Proc. IEEE, 98 (5), 735 – 751, doi: 10.1109/JPROC.2009.2034765.
Other Publications and Conferences
Farrell, S. L., N. T. Kurtz, V. Onana,
J. P. Harbeck, and K. Duncan, 2011b: Sea Ice Lead Distribution from High Resolution Airborne Imagery, Abstract C52B-03 presented at 2011 Fall Meeting, AGU, San Francisco, Calif., 5-9 Dec. 2011.
Farrell, S., K. Brunt, T. Markus, and A. Neuenschwander, 2011c: A First Look at MABEL L2A Data over a Sea Ice Analogue, ICESat-2, SDT Meeting, Martin Johnson House (T-29), Scripps Institution of Oceanography, La Jolla, C.A., September 7-8, 2011.
Farrell S. L., 2011d: Arctic Ocean Topography and Lead Statistics from Altimetry: An Observational Validation data-set for AOMIP, Arctic Ocean Model Intercomparison Project (AOMIP) Workshop, Woods Hole Oceanographic Institution, Massachusetts, November 1-4, 2011.


