")
Climate Observation
By: Phil Arkin
Climate is challenging to define, and maybe even more difficult to observe. In fact, to some degree the term “climate observation” is meaningless – we observe properties of the climate system, including the atmosphere, the oceans, and other components of the system on short time scales and from those observations construct, by averaging or in some other way, measures of “climate”. In addition, it’s nearly impossible to experience “weather” without taking into consideration the “climate” context, and confusing the two is hard to avoid. (This reminds me of a talk I saw many years ago on the problem of distinguishing figure from ground, something that all of us can relate to via the drawing of a vase that morphs into two faces looking at each other, and which plagues attempts to develop computerized vision algorithms.)
This situation leads to considerable confusion and consternation – witness all the discussion of the extraordinary weather of March 2012 (as usual, I rely on the Capital Weather Gang for their summaries and discussion and recommend them highly). The individual extreme warm daily temperatures observed in the US and Canada during that month were weather: they resulted from a hugely atypical circulation pattern that persisted for a large part of the month. Of course, that persistent circulation is part of the climate as well, and certainly the monthly and seasonal temperature anomalies, which were among the largest we’ve ever seen, would be considered “climate” as opposed to weather. However, they certainly aren’t the entire story – North America is a small part of the globe, and the global mean surface temperature anomaly for March 2012 was actually rather modest compared to the past decade.
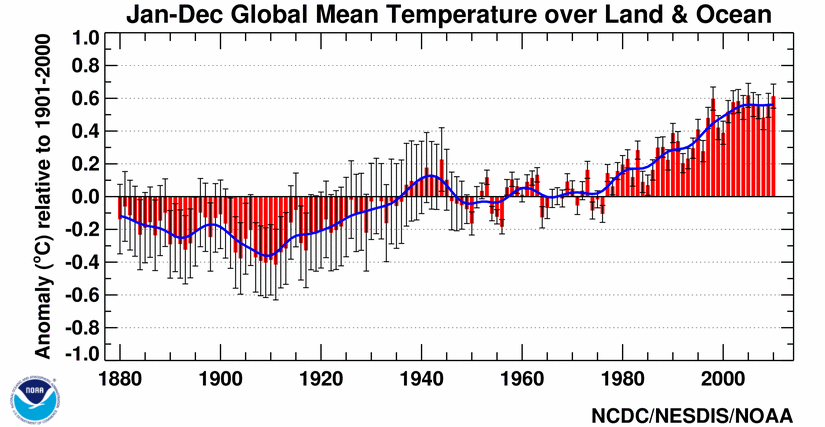
Observing climate is of limited interest to many – they are satisfied to let the involved climate scientists work out the details and provide results. However, there are a lot of devils hidden in those details, and a brief introduction may be useful. The most common climate observations that the general public hears about are the global or regional surface temperature anomalies. These time series are probably quite familiar by now, and have led to a certain amount of argument over methods, but very few people who understand the details doubt that the global average temperature has increased substantially in the past century, and particularly in the past 30 years. Calculating a value for the global mean surface temperature is not at all trivial, but several groups have worked out methods over many years and the results seem quite solid.
A bigger challenge comes when we try to understand climate change and variability and events such as the March 2012 warmth in more detail. For example, how extreme was the tropospheric height anomaly in central North America? Have such extreme height anomalies become more common recently? Is there a tilt recently toward more extreme positive height anomalies, associated with warm temperatures, and fewer negative anomalies? Certainly there seem to be more warm records than cold ones this year, but what “observations” can we use to understand the scientific context? Since I don’t want these posts to be too long, I’m going to end here with a two-word answer – climate analyses. Of course, that means I have to do another one soon to explain what climate analyses are, why they are needed to answer these questions, and why we don’t yet have all the “climate observations” we need.


