New Research Finds Climate-Critical Ocean Current System is Slowing
Cazzy Medley
Press Releases
While scientists have observed oceans heating up for decades and theorized that their rising temperatures weaken global currents, a new study led by a University of Maryland researcher documents for the first time, based on field data from the World Ocean Database and climatology from the World Ocean Atlas, a significant slowing of a crucial ocean current system that plays a role in regulating Earth’s climate.
Published recently in Frontiers in Ocean Science, the paper led by Earth System Science Interdisciplinary Center (ESSIC) scientist Alexey Mishonov examined decades of field data on seawater temperature and salinity found in the National Oceanic and Atmospheric Administration’s (NOAA) largest oceanographic database.
Mishonov and his colleagues, Dan Seidov and James Reagan from NOAA, found that AMOC remained stable and consistent from 1955 to 1994. AMOC, which includes the Gulf Stream, plays a vital role by carrying warm water towards higher latitudes, releasing heat into the atmosphere, and bringing cold waters to the tropics. This forms a continuous loop that redistributes heat across the ocean. However, in the mid-90s, AMOC strength began to decline, with the current beginning to move slower than it had. Scientists attribute this slowdown to the continued warming of the ocean surface and the accompanying changes in the salinity of the ocean’s upper layers. This slowdown has brought about concerns regarding the future of the North Atlantic Ocean climate.
“If AMOC slows down, the heat exchange will be reduced, which in turn will affect the climate, causing hot areas to get hotter and cold areas to get colder,” says Mishonov. This could lead to global climate changes, sea level rise, impact on marine ecosystems, and other climate feedbacks.
Mishonov and co-authors believe that the key to understanding the ocean climate trajectory is identifying how the decadal North Atlantic climate responds to ongoing surface warming.
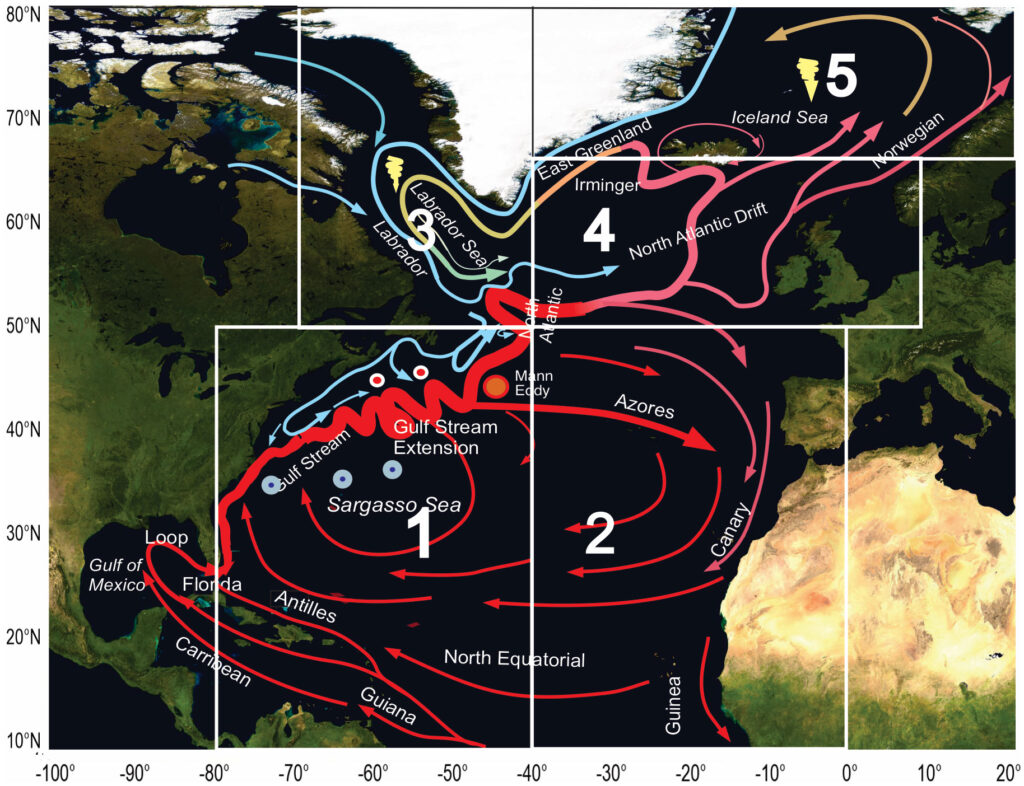
Figure 1. A scheme of the upper-layer circulation of the North Atlantic Ocean. Red – warm currents, blue – cold currents. White boxes 1 to 5 indicate five different areas of analysis where temperature, salinity, and current velocities presumably differ considerably. Comparative analysis of the decadal averages of various variables in the entire North Atlantic and each box can shed additional light on how the North Atlantic climate system functions and help better understand how stable this system is as a whole and in its segments.
Figure 2. Decadal variability of the annual sea water temperature anomalies at the different depth relative to the climate normals (°C), i.e., the individual decades minus 1965-1994 climate normals: (A) in the entire North Atlantic; (B–F) in the selected boxes 1 through 5 shown in Figure 1. Vertical axis – temperature anomalies, °C; horizontal axis – decades.
The researchers used in-situ WOA data covering 1955-1964 to 2005-2017 as well as climate reanalysis data on decadal wind stress and sea surface height (SSH) fields from UMD’s Simple Ocean Data Assimilation project to determine fingerprints of the North Atlantic’s circulation and AMOC’s dynamics.
The authors found that although the entire North Atlantic is systematically warming, the climate trajectories in different subregions of the North Atlantic reveal radically different characteristics of regional decadal variability reflecting diverse climate patterns. It is shown that, in the mid-Atlantic region (boxes 1 and 2 in Figure 1), the temperature has gradually increased from 1955 to 2017 (see Figure 2 below). However, in the more northern Atlantic (boxes 3-5 in Figure 1), temperatures drop from 1955 to 1994, then rise from 1995-2017. Similar patterns are also visible in other climate characteristics like salinity and density.
This variation in climate characteristics indicates that the current situation may not be entirely reflective of what the future may hold. The authors do not know if AMOC’s slowdown will persist, accelerate, or diminish in the next decade. However, the paper suggests that scenarios involving the slowdown or collapse of AMOC cannot be completely dismissed. Next, the authors plan to explore other regions of the World Ocean to look for similar patterns in the long-term temperature and salinity variability.
Mishonov is a researcher with extensive experience in various fields of oceanography, including ocean color, water transmissivity and particulate organic carbon study, oceanographic data management, analysis, and climate research.

")