")
UMD/NOAA Coral Reef Watch has been using new satellite products to enact real change to protect coral reefs from the threats of climate change.
This year, we’ve seen unprecedented heat in the world’s oceans. Since the spring– well before the usual ocean seasonal peak temperatures of August and September – the ocean has been setting annual records for global ocean heat and sea surface temperatures. This is causing intense heat stress conditions for ocean life across the globe.
One of the most vulnerable marine ecosystems are coral reefs. When ocean temperatures get too hot, the symbiotic relationship between corals and the algae that live in their tissues breaks down. Without the algae, the coral host loses its major food source and turns white or very pale, a process known as coral bleaching. A bleached coral is essentially starving to death. Corals can recover from bleaching if the heat stress subsides, but the corals that are able to recover will have impaired growth, reproduction, and be susceptible to disease for 2-4 years after recovery. If the heat stress is severe, prolonged, or does not subside, the corals will die.
In order to predict, respond to, and communicate effectively about ocean heat stress events and their impacts on coral reef ecosystems, decision-makers use the tools developed by the NOAA Coral Reef Watch (CRW) program, an initiative supported by the Earth System Science Interdisciplinary Center (ESSIC)-administered Cooperative Institute for Satellite Earth System Studies (CISESS). These include NOAA CRW’s daily global 5km satellite coral bleaching heat stress products (an example of one product, known as the Daily 5km Regional Virtual Stations, is below) and modeled Four-Month Coral Bleaching Heat Stress Outlook.
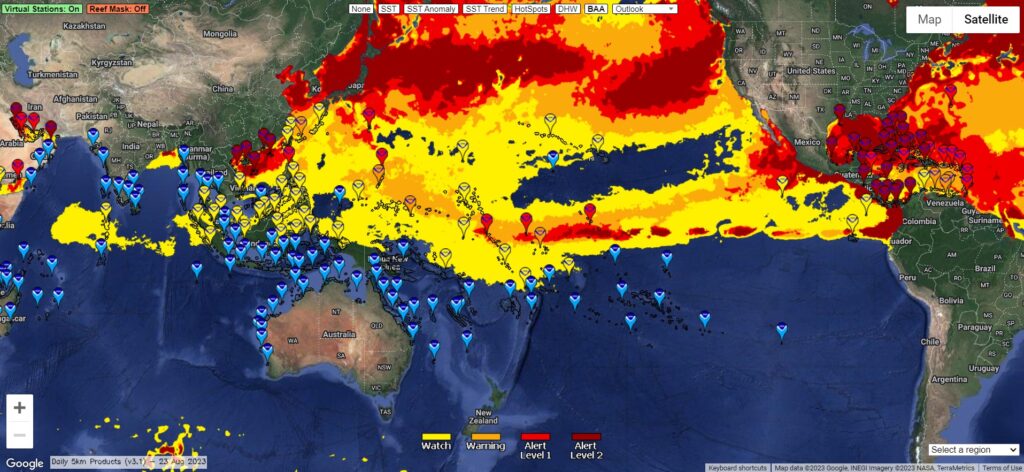
This year’s early warming, especially in locations like the Florida Keys, has been unprecedented. Sea surface temperatures are as high or higher than ever previously documented in the satellite record, and heat stress accumulated earlier than ever before. Based on CRW’s predictions and near real-time satellite monitoring for Florida, NOAA started planning a coral rescue strategy in June to conduct a coordinated response to the mass bleaching event that unfolded in July and August.
“When our Florida Keys Regional Virtual Station began to send alerts in July, a full month earlier than heating typically starts in Florida, we knew something unusual was unfolding,” said Erick Geiger, an ESSIC Faculty Specialist and Support Scientist and Product Developer for NOAA CRW.
With critical input from Florida coral reef management partners, Geiger quickly developed a new set of single-pixel satellite Virtual Stations to track heat stress at key nursery and restoration sites across Florida’s Coral Reef, including the seven Mission: Iconic Reefs sites. Combining satellite measurements of sea surface temperature with CRW’s bleaching heat stress algorithms, single-pixel Virtual Stations provide crucial information for coral reef stakeholders to help them act quickly and effectively to manage and protect their local reefs from severe heat stress events.
“Single-pixel Virtual Stations are like having a virtual buoy in the water showing measurements from satellites through time,” said Geiger, “These data allow reef stakeholders to compare and contrast heat stress levels across sites and prioritize triage efforts to key areas where heat stress is the greatest threat.”
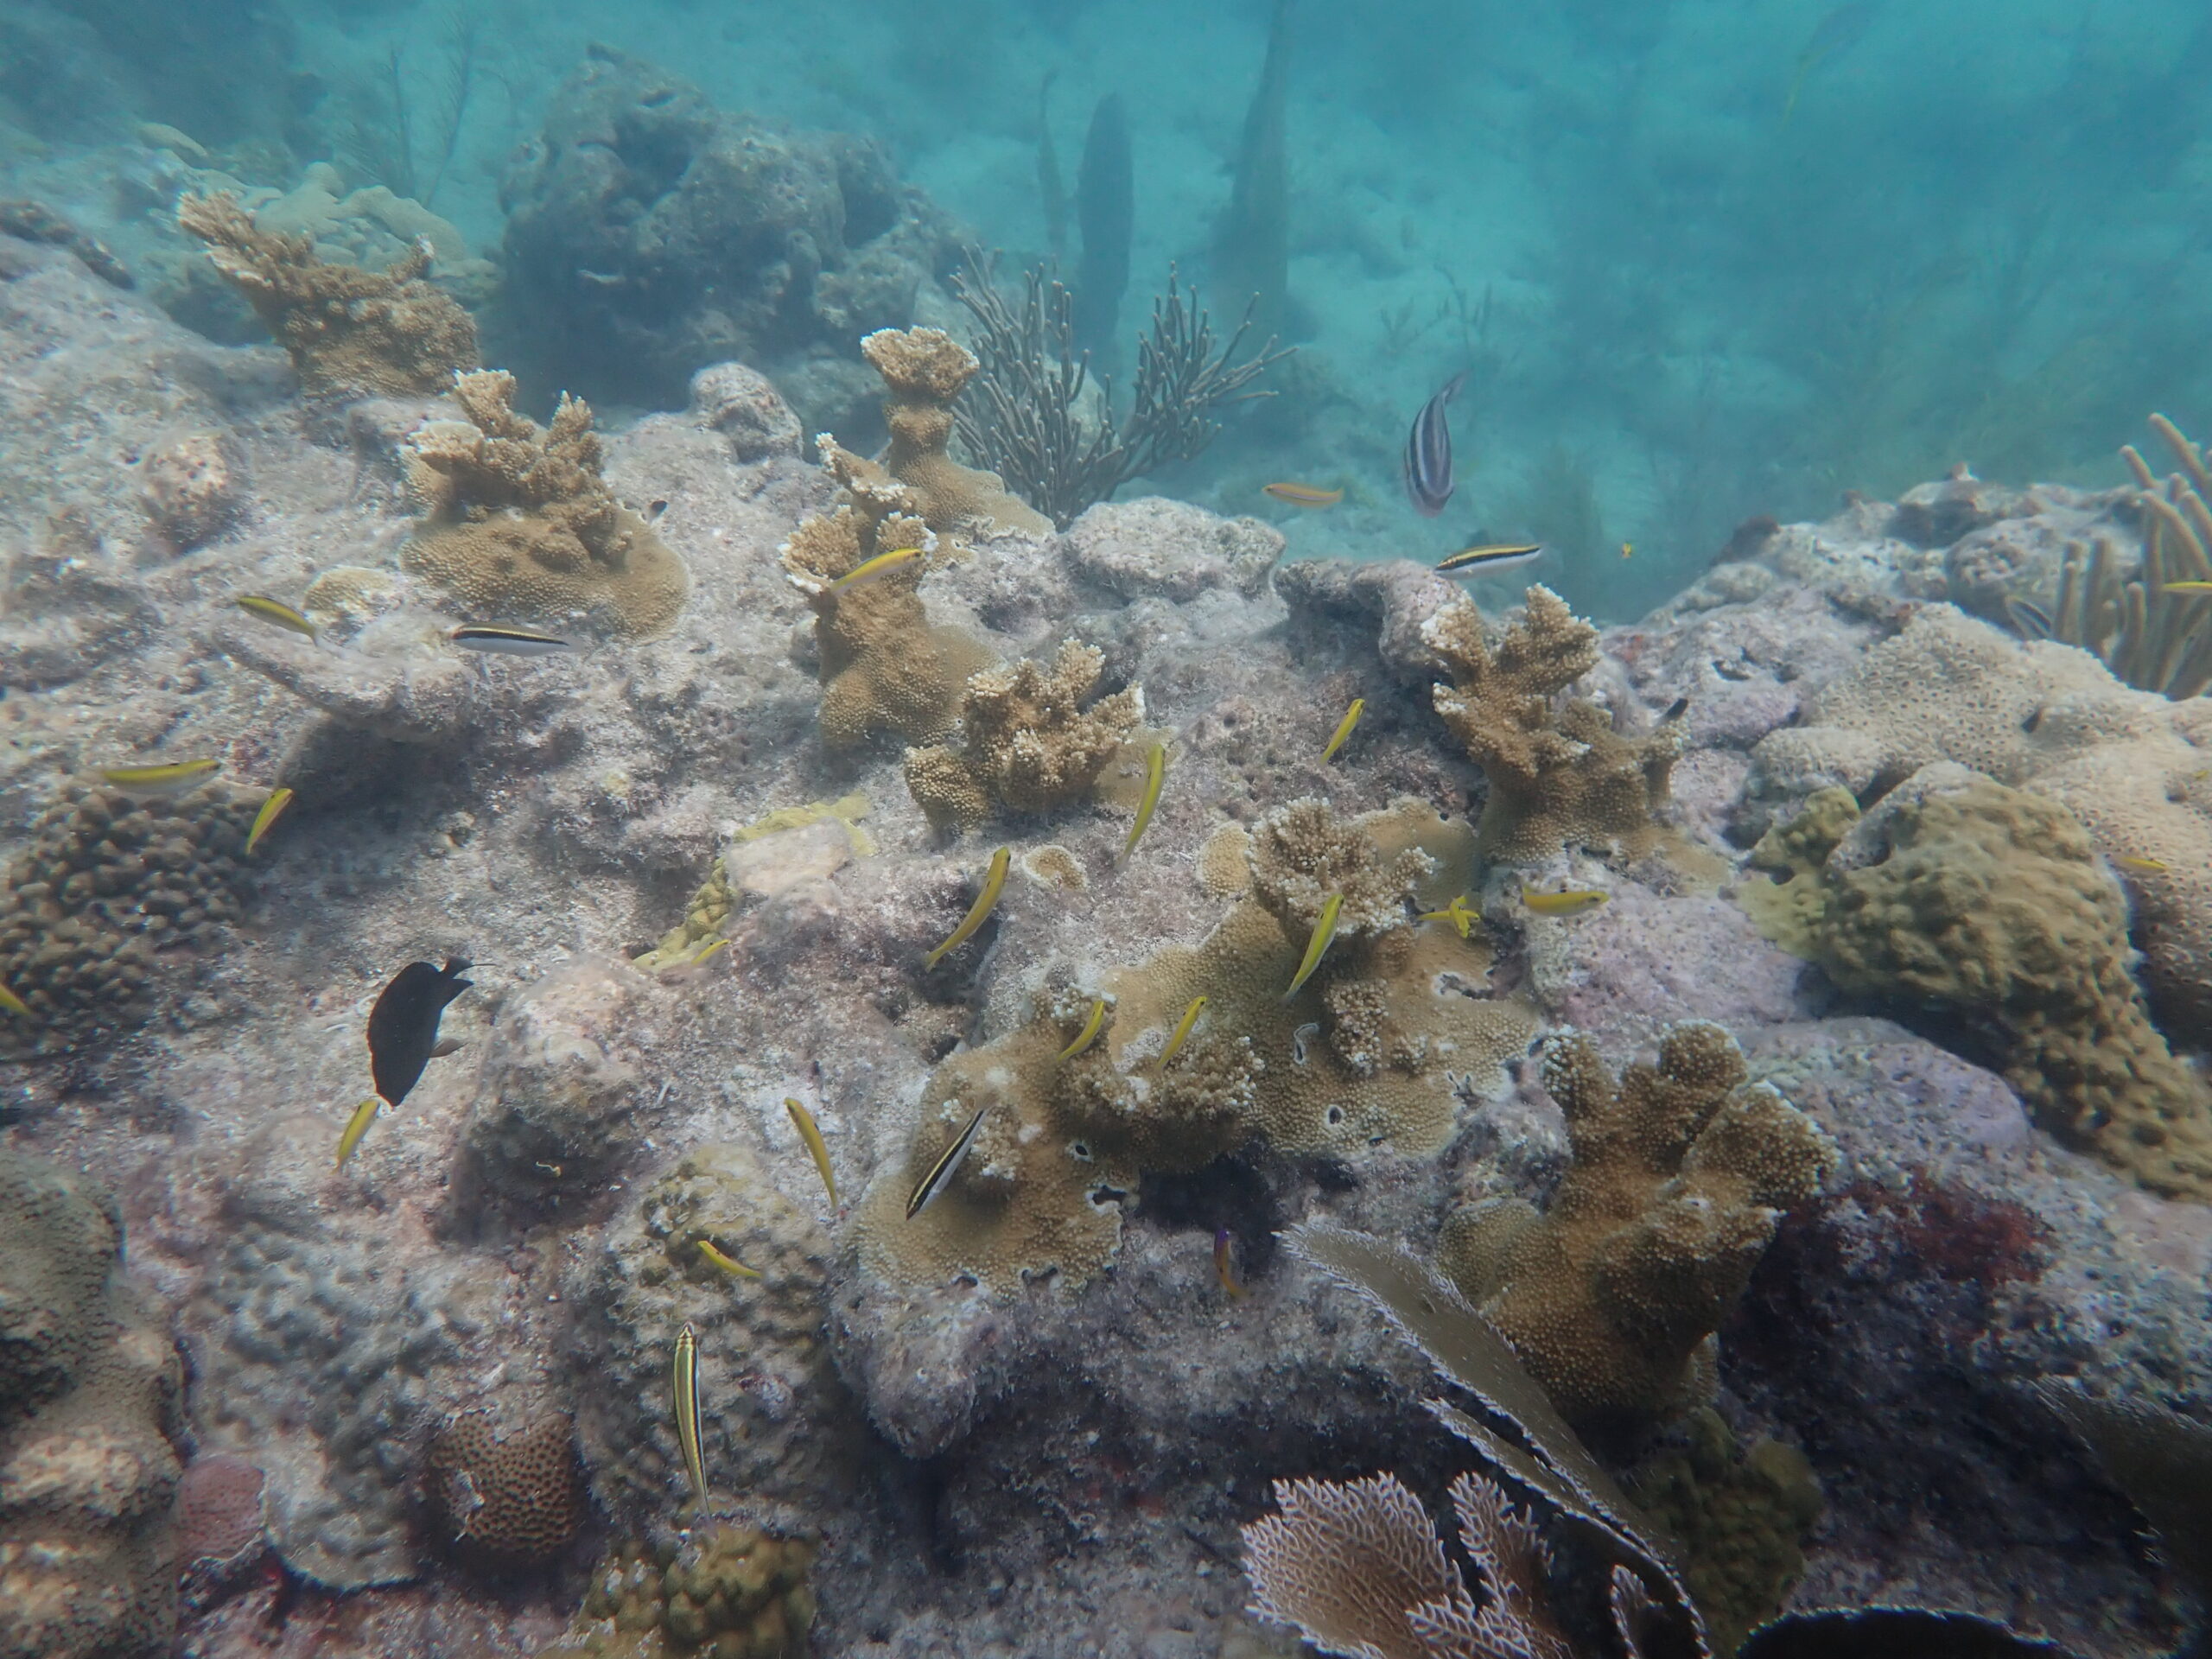
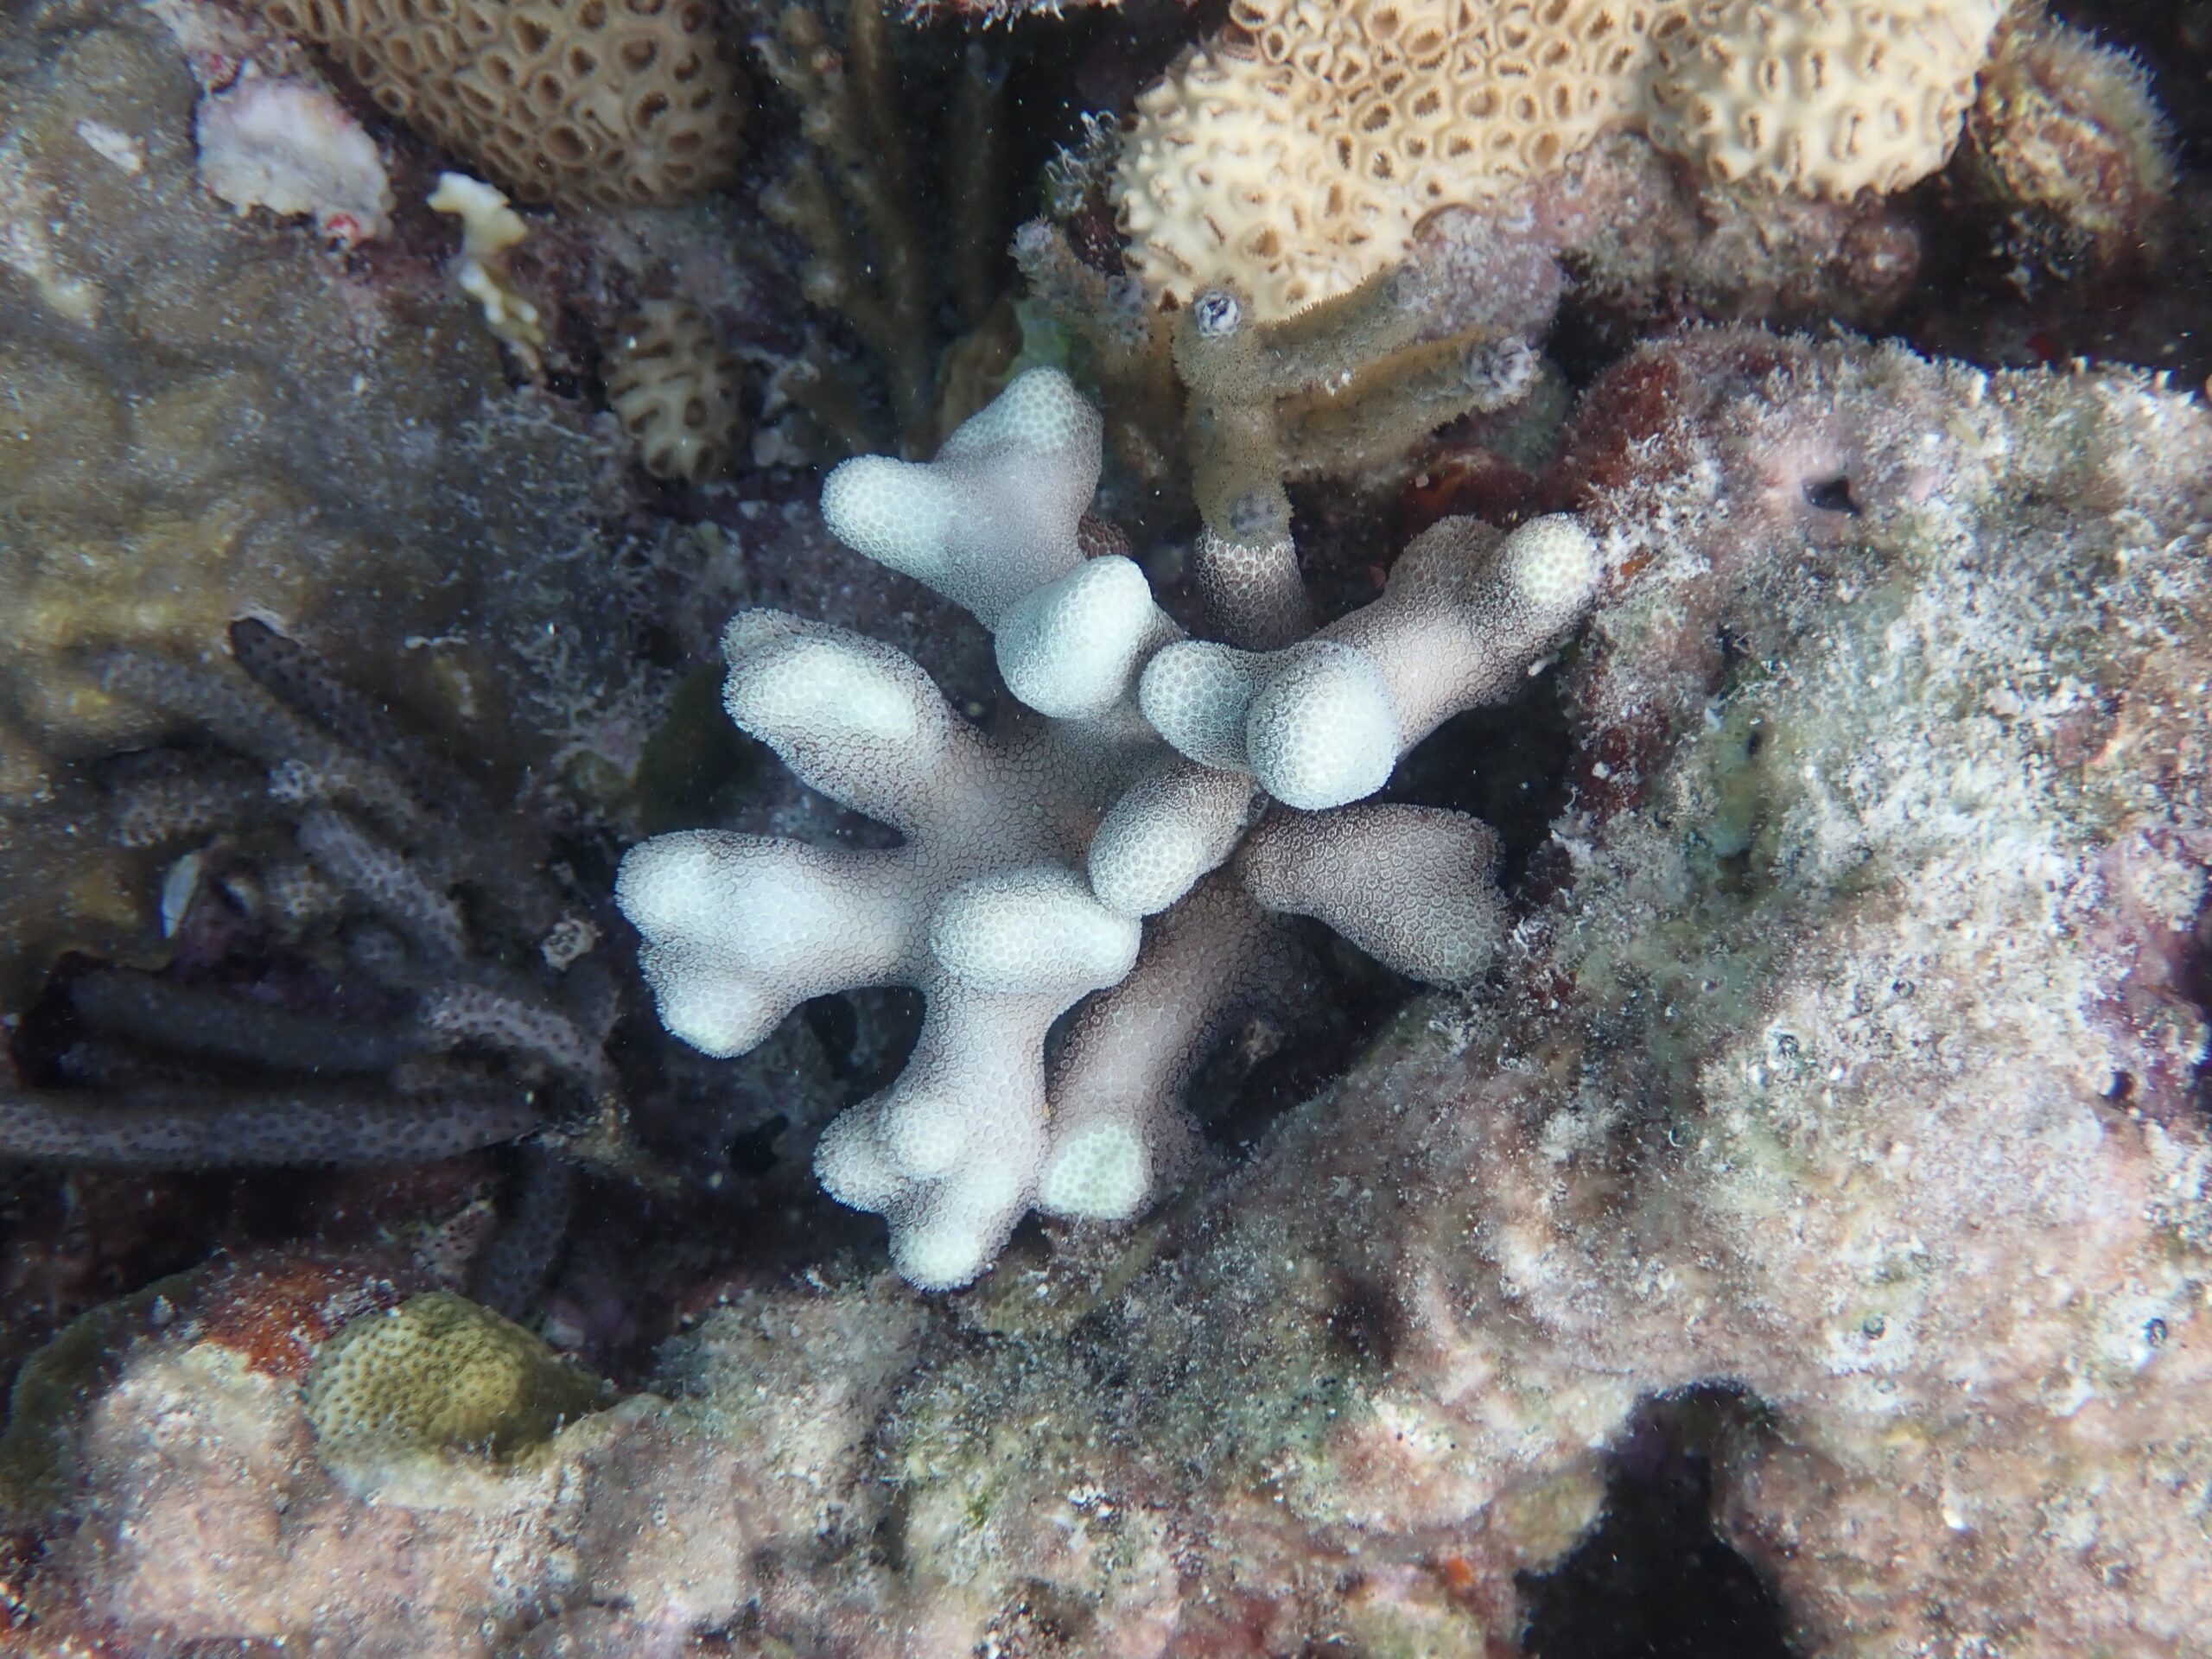
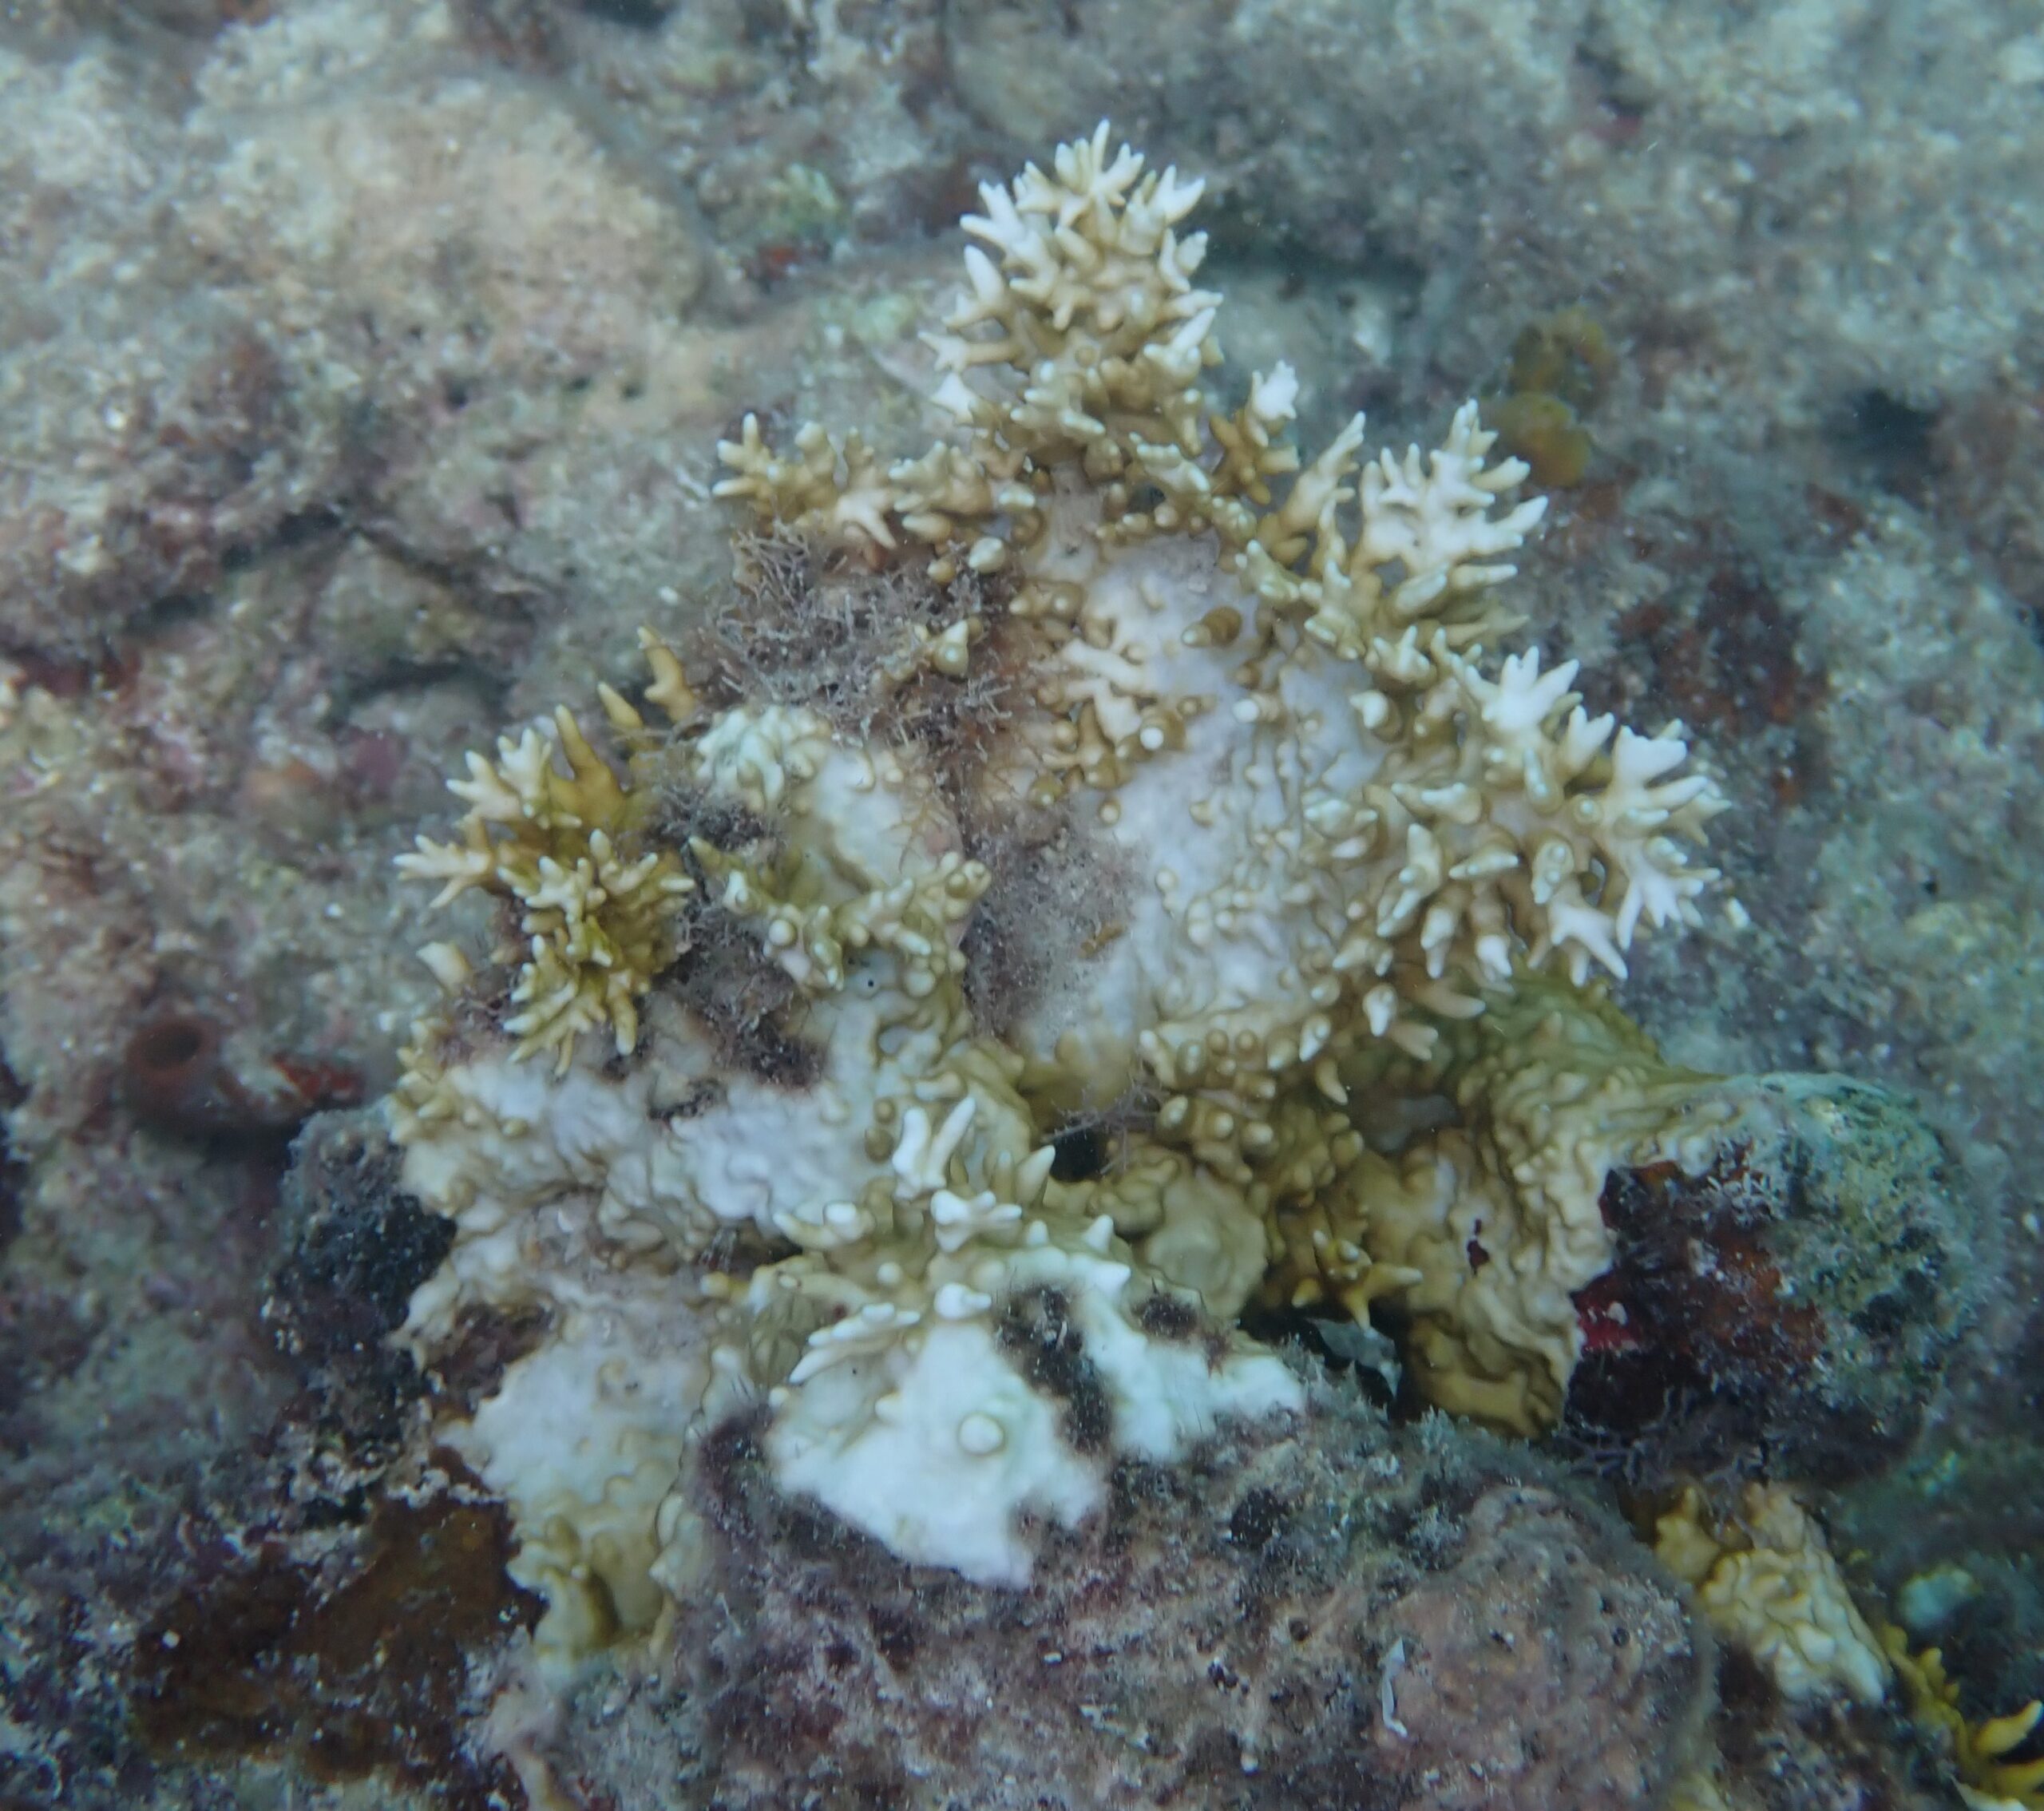
Pictured: Elkhorn coral in the Eastern Dry Rocks, a coral reef off of the Florida Keys. The top photo depicts healthy, 2-year outplants. The two bottom photos depict coral bleaching as a result of rising ocean temperatures. CREDIT: Katey Lesneski/NOAA
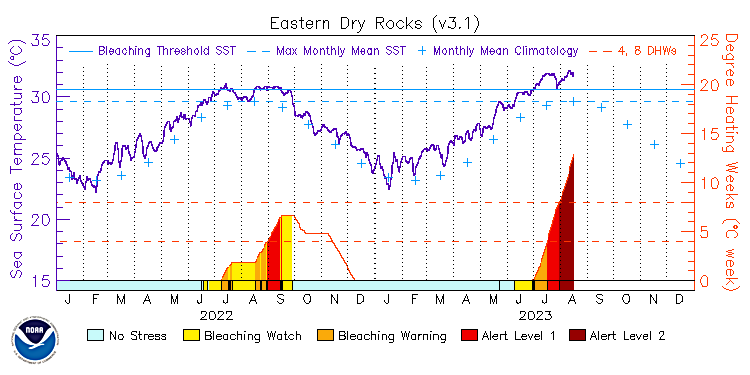
How Do Single-Pixel Virtual Stations Work?
Like a buoy, single-pixel satellite Virtual Stations track sea surface temperature (the left Y-axis and the solid purple line on the graph above). To determine if a coral is undergoing heat stress that can lead to bleaching, researchers first need to determine what temperature is considered “normal” – a baseline – for any given location. NOAA CRW finds this baseline by averaging temperatures for each month over a certain amount of years; in this case the climatological baseline is 1985-1990 plus 1993. On the graph, the monthly baseline temperature for Eastern Dry Rocks, a coral reef off the Florida Keys, is represented by the light blue plus signs.
Since reef-building corals live near their upper thermal limits , Geiger and his team are interested in any temperatures that are above the hottest summertime temperature that the corals are used to. The maximum monthly mean temperature that the corals experience is represented by the light blue dashed line on the graph. When ocean temperatures exceed the maximum monthly mean temperature, “HotSpots” occur. When a HotSpot happens, the bottom portion of the graph turns yellow indicating a “Bleaching Watch”.
When temperatures reach as little as 1 degree Celsius above the maximum monthly mean, corals become stressed. One degree Celsius above the maximum monthly mean is known as the bleaching threshold temperature, and is represented by a solid, light blue line on the graph. If the ocean temperature climbs above the bleaching threshold, then the bottom portion of the graph turns orange indicating a “Bleaching Warning”.
The accumulated stress on the corals is measured on the right Y-axis using a metric called “Degree Heating Week”. The researchers get this value by adding up all of the daily HotSpots over the prior 12-week period and dividing by 7. When the accumulated heat stress goes above the dotted red line at 8 Degree Heating Weeks, the coral reef environment is at “Bleaching Alert Level 2”; severe, widespread bleaching is expected and significant coral death is likely.
“For humans, one or two hot days may not seem that bad, as long as a cool day happens again shortly after. But weeks of very hot temperatures are stressful and you don’t want to go outside,” said Geiger. “The same is true for corals. Many days with HotSpots above the bleaching threshold stresses the corals and their symbiotic algae; so the algae are expelled, but the corals can’t go anywhere to relieve the stress. So the corals bleach, and if the heat stress continues, the corals can die.”
Applying the Knowledge to Save Corals
With remarkable speed, Geiger was able to construct single-pixel Virtual Stations for 18 sites, seven of which are designated Mission: Iconic Reefs sites. This has enabled responders to quickly and effectively steer in-water efforts to protect corals at sites where there is active restoration or established nurseries.
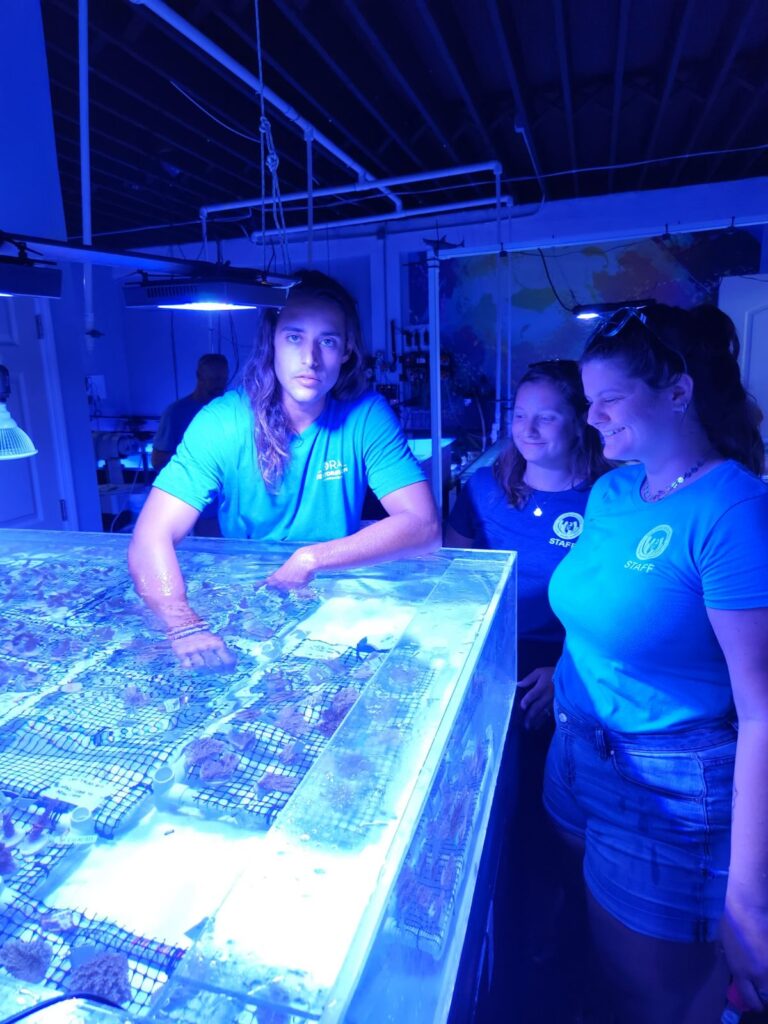
Thousands of corals have been rescued from shallow-water nurseries and transported to land-based holding tanks, where they will remain for the duration of the severe heat stress event. Other corals have been temporarily moved to deeper waters, where it is cooler and light levels are less intense.
In addition to the overwhelmingly positive response from the Florida coral reef community, which is actively using CRW’s new single-pixel satellite Virtual Stations, development of this critical tool marks an early milestone achievement for the CRW Science Team, not planned until 2024. Due to Geiger’s work and this initiative’s success, requests for other single-pixel Virtual Stations have been rolling in to CRW to cover other key reef sites in the U.S. and international locations.
As ocean warming continues – including a potential basin-wide mass coral bleaching event in the Caribbean and maybe even another global coral bleaching event – development of additional single-pixel satellite Virtual Stations will become even more critical.
“Coral Reef Watch’s goal as a program is to provide the most accurate information possible to support coordinated management and monitoring of coral reefs in the U.S. and around the world. I believe these new Virtual Stations help accomplish that,” said Geiger.


